What this section is for #
The Provider report section allows the Provider to monitor the operational use of the platform within their tenants.
This reporting is not intended to evaluate how individual Players’ training attempts went, nor to analyze readiness, Communication Skills, Observation Grids, or the quality of conversational performance.
Its objective is different: to provide the Provider with a governance view of usage, consumption, capacity, and service continuity.
From this section, the Provider can check:
- how many simulations have been delivered;
- how many minutes have been consumed;
- which tenants are using the platform;
- how many sessions have been started;
- how many sessions were completed, interrupted, or had errors;
- any access queues for simulations;
- any interruptions for Player protection in aggregate form;
- usage of simultaneous connection slots;
- possible operational alerts;
- recommended actions to improve capacity, continuity, and usage.
Difference between Provider Reports and Training Reports #
The Provider Report is a usage and governance report.
It serves to answer questions such as:
- How many simulations were used?
- How many minutes were consumed?
- Were there capacity issues?
- Did Players stay in the queue?
- How many sessions were completed?
- Were there interruptions for protection?
- Which tenants are consuming the most resources?
- Is it necessary to increase slots, minutes, or capacity?
It is not, however, intended to answer questions such as:
- Did the Player demonstrate the expected Communication Skills?
- What is the Player’s readiness?
- What key moments emerged in the conversation?
- Which communication areas does the Player need to improve?
This information belongs to the Tenant Admin’s training reporting or the Player’s personal reporting, according to the configured privacy policies.
Filters #
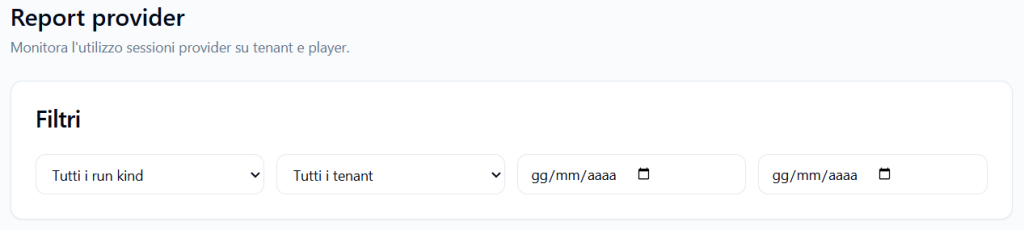
The Filters section allows you to narrow down the data view.
Filters may include:
- run type;
- tenant;
- start date;
- end date.
Run type #
The run type filter allows you to distinguish between different types of sessions.
Examples:
- all runs;
- official sessions only;
- internal tests only;
- tenant runtime sessions.
This filter is useful because the Provider’s internal tests and the Players’ official sessions may have different purposes, but both can consume resources.
Tenant #
The tenant filter allows you to view data related to:
- all tenants;
- a specific tenant.
It is useful when the Provider wants to understand the consumption or operational performance of a single client, department, or group.
Date range #
The date fields allow you to select a specific period for analysis.
The Provider can use this filter to analyze:
- a single day;
- a week;
- a month;
- a delivery period;
- a training event;
- a testing window.
General session view #
The page can show a general summary of the recorded sessions.
Key data may include:
- number of sessions;
- runtime minutes;
- last activity;
- list of simulations performed;
- associated tenant;
- connected user or actor;
- minutes consumed;
- session status.
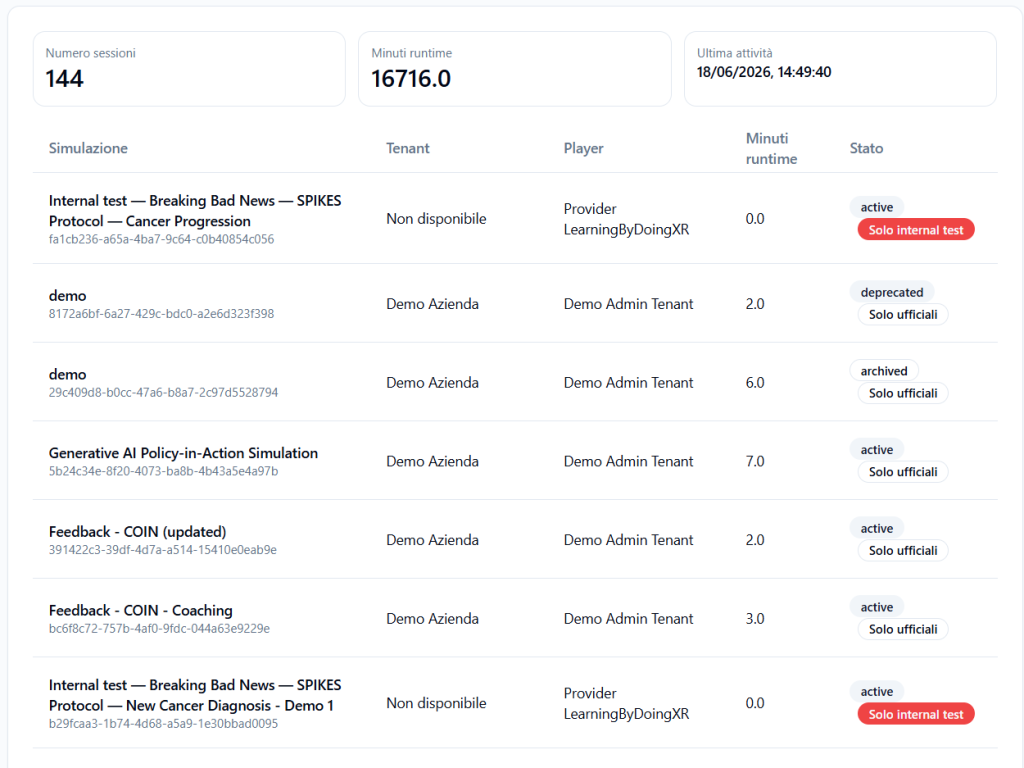
Number of sessions #
Indicates how many sessions were recorded in the selected period.
Example:
144
This value helps to understand the overall volume of platform usage.
Runtime minutes #
Indicates the total minutes consumed by runtime sessions in the selected period.
Example:
16716.0
This data is important for monitoring consumption relative to the minutes included in the Provider plan or relative to tenant allocations.
Last activity #
Shows the date and time of the last recorded session.
It is useful for understanding if the platform has been used recently.
Session list #
The sessions table shows the operational details of the recorded sessions.
Columns may include:
- simulation;
- tenant;
- player or actor;
- runtime minutes;
- status.
Simulation #
Shows the name of the simulation or session.
It can also include internal test sessions.
Example:
Internal test — Breaking Bad News — SPIKES Protocol — Cancer Progression
Internal test sessions are trials started by the Provider to verify the behavior of the simulation.
Tenant #
Shows the tenant associated with the session.
If the session is a Provider internal test, the tenant may appear as not available or not applicable.
Player or actor #
Shows the user or actor connected to the session, when available.
In the case of internal tests, the Provider or an administrative user may appear.
Runtime minutes #
Indicates how many minutes were consumed by that session.
This value contributes to the overall consumption of minutes.
Status #
Shows the status of the session.
Examples:
- active
- archived
- deprecated
- Internal test only
- Official only
The status helps distinguish operational sessions, internal tests, archived sessions, or runtimes that are no longer current.
Provider runtime dashboard #
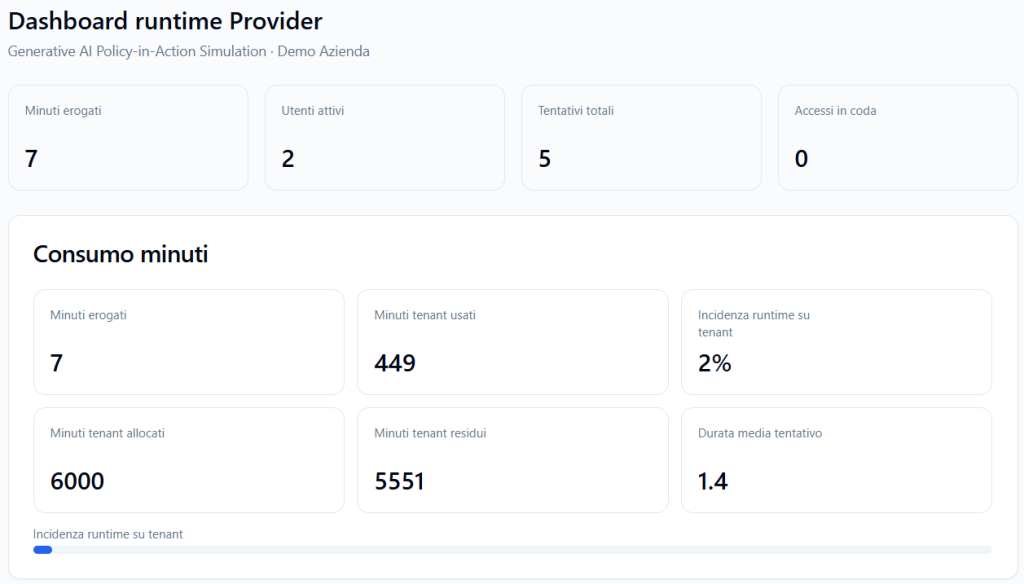
When a specific runtime is analyzed, the platform can show a Provider runtime dashboard.
This dashboard offers a usage view of a specific simulation connected to a tenant.
Examples of data shown:
- minutes delivered;
- active users;
- total attempts;
- queued accesses.
Minutes delivered #
Indicates how many minutes were consumed by that runtime.
Example:
7
Active users #
Indicates how many users have used or are using that runtime in the period considered.
Example:
2
Total attempts #
Indicates how many attempts have been recorded for that runtime.
Example:
5
Queued accesses #
Indicates how many accesses ended up in the queue because the available capacity was not immediately sufficient.
Example:
0
If this value grows, it may indicate that the available simultaneous capacity is not adequate for usage peaks.
Minute consumption #
The Minute consumption section shows how the runtime contributes to the tenant’s consumption.
It can include:
- minutes delivered;
- tenant minutes used;
- runtime impact on the tenant;
- tenant minutes allocated;
- remaining tenant minutes;
- average attempt duration.
Minutes delivered #
Shows the minutes consumed by the specific runtime.
Tenant minutes used #
Shows how many minutes have been consumed overall by the tenant in the selected period or context.
Runtime impact on the tenant #
Indicates how much that runtime weighs on the tenant’s overall consumption.
Example:
2%
This data helps the Provider understand if a specific simulation is consuming a significant portion of the resources assigned to the tenant.
Tenant minutes allocated #
Shows the minutes assigned to the tenant.
Remaining tenant minutes #
Shows how many minutes remain available to the tenant.
Average attempt duration #
Shows the average duration of attempts on that runtime.
This data is useful for estimating future consumption if the runtime is used by many Players.
Attempts #
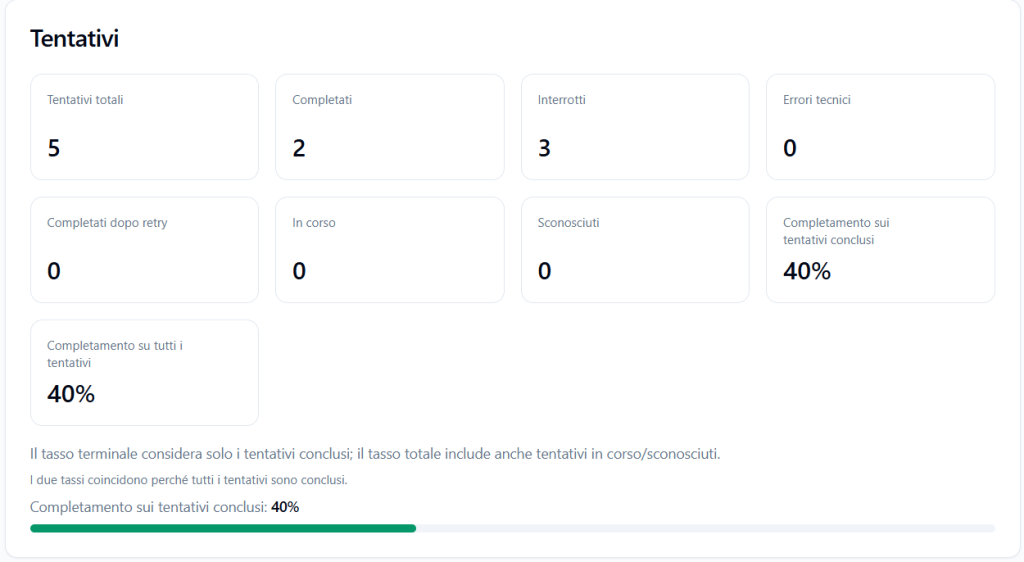
The Attempts section shows the operational status of the recorded attempts.
It can include:
- total attempts;
- completed;
- interrupted;
- technical errors;
- completed after retry;
- in progress;
- unknown;
- completion on concluded attempts;
- completion on all attempts.
Total attempts #
Indicates the overall number of recorded attempts.
Completed #
Indicates how many attempts reached completion.
Interrupted #
Indicates how many attempts were interrupted.
Interruptions can depend on various causes, such as early exit, Player protection, or other events.
Technical errors #
Indicates how many attempts had technical errors.
This data is important for monitoring the operational reliability of the platform.
Completed after retry #
Indicates how many attempts were completed after a new attempt or a resumption.
In progress #
Indicates how many attempts are still in progress.
Unknown #
Indicates attempts for which the status has not been fully classified.
Completion rate #
The platform can show two values:
- completion on concluded attempts;
- completion on all attempts.
The first considers only attempts that have a final status.
The second also includes attempts in progress or unknown.
This distinction helps to correctly interpret the completion rate.
Interruptions for protection #
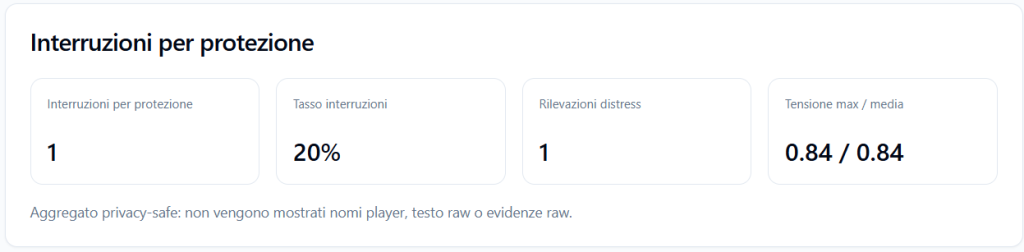
The Interruptions for protection section shows aggregate information on sessions automatically interrupted for Player protection.
It can include:
- interruptions for protection;
- interruption rate;
- distress detections;
- maximum/average tension.
Example:
- Interruptions for protection: 1
- Interruption rate: 20%
- Distress detections: 1
- Max/average tension: 0.84 / 0.84
This section is privacy-safe: it does not show Player names, raw text, or raw evidence.
It serves the Provider to understand if a runtime is generating an excessive level of tension or if it might require a design review.
Capacity and queue #
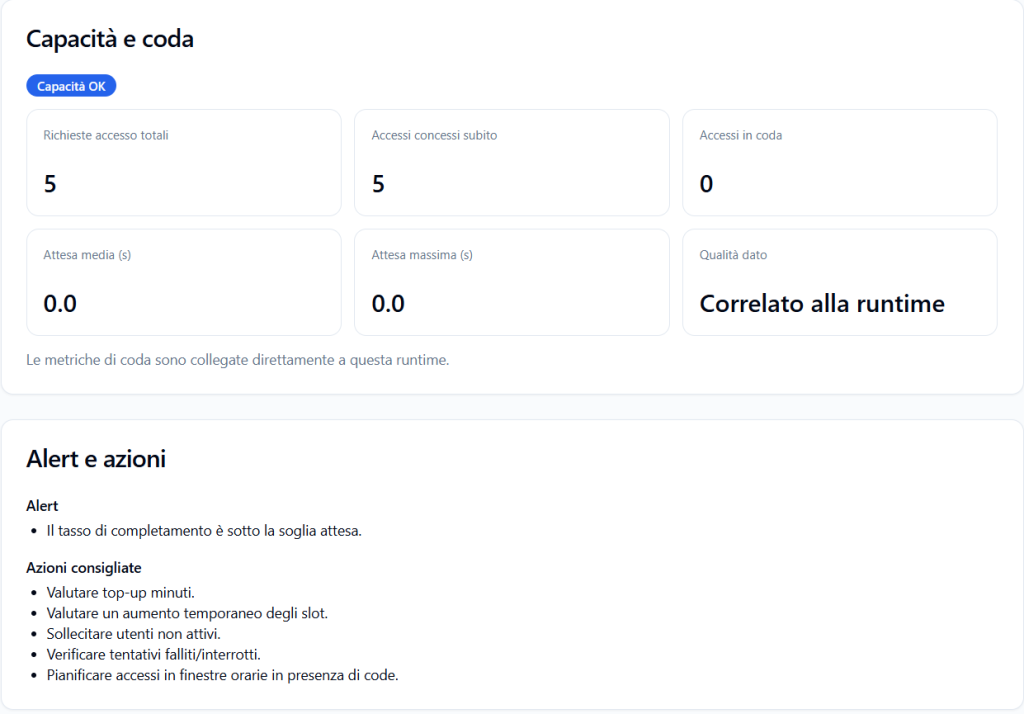
The Capacity and queue section shows how the runtime used the available capacity and if there were any waits.
It can include:
- total access requests;
- accesses granted immediately;
- queued accesses;
- average wait;
- maximum wait;
- data quality.
Total access requests #
Indicates how many access requests were recorded for that runtime.
Accesses granted immediately #
Indicates how many requests were satisfied immediately, without a queue.
Queued accesses #
Indicates how many requests had to wait before entering the simulation.
If the value is high, it may indicate saturation of the available slots.
Average wait #
Shows the average wait time, in seconds.
Maximum wait #
Shows the maximum wait time recorded.
Data quality #
Indicates the quality or level of correlation of the data.
Example:
Correlated to the runtime
This means that the queue metrics are directly linked to the selected runtime.
Alerts and recommended actions #
The Alerts and actions section shows any operational signals that require attention.
Alerts are not training evaluations of the Player, but governance indications.
Example of an alert:
- the completion rate is below the expected threshold.
Recommended actions may include:
- evaluating a minute top-up;
- evaluating a temporary increase in slots;
- prompting inactive users;
- checking failed or interrupted attempts;
- planning access in time windows when queues are present.
These indications help the Provider intervene on an operational level.
How to use this reporting #
The Provider should use this section to govern the use of the platform.
Examples of useful questions:
- Are tenants using the assigned resources?
- Are there tenants with very low or very high consumption?
- Are the runtimes generating queues?
- Are the simultaneous slots sufficient?
- Are there many interrupted sessions?
- Are the monthly minutes sufficient?
- Are internal tests consuming many resources?
- Is it necessary to review tenant allocations?
- Is it necessary to increase the plan or purchase additional capacity?
What not to interpret from this section #
This section must not be used to evaluate the individual training quality of Players.
It should not be used to conclude that a Player:
- communicates well or poorly;
- has or has not achieved a skill;
- has high or low readiness;
- has passed or failed a simulation.
These elements belong to training reports.
The Provider Report shows usage and governance data, not judgments on individual performance.
Internal tests and resource consumption #
Sessions of internal tests may appear in the Provider reporting.
These tests serve to verify simulations and Avatar Personas before distribution.
It is important to remember that internal tests:
- consume minutes from the Provider’s minute pool;
- occupy shared simultaneous connection slots;
- are tracked as operational sessions;
- may appear in the sessions table;
- must not be confused with official Player attempts.
Best practices for the Provider #
To correctly use the Provider Report section, it is advisable to:
- regularly check the minutes consumed;
- filter by tenant when analyzing a specific client or department;
- distinguish between official sessions and internal tests;
- monitor queued accesses;
- evaluate increasing slots if queuing becomes frequent;
- check the completion rate of runtimes;
- check interruptions for protection in aggregate form;
- use alerts as operational indications;
- not use this reporting as an individual evaluation of Players;
- compare this data with the Plan and Resources to decide on any upgrades or reallocations.
Final result #
The Provider Report section offers a governance view of platform usage.
It allows for monitoring sessions, minutes, tenants, runtimes, queues, completions, interruptions, and resource consumption.
Its purpose is to help the Provider manage capacity, costs, service continuity, and the operational quality of the ecosystem.
The training evaluation of Players remains separate and is managed in the report sections dedicated to Tenant Admins and Players, according to the configured privacy policies.


