What this section is for #
The Audit section allows the Provider to consult the history of events recorded by the platform for their own Provider environment and for connected tenants.
This section serves to ensure traceability of the main operational, administrative, and system actions.
Audit is not a section for modifying data, but a control view that allows you to verify:
- when an action was performed;
- which tenant is involved;
- which entity was modified or generated;
- whether the action was performed by a user or by the system;
- which technical metadata are linked to the event.
It is especially useful for monitoring activities, troubleshooting, technical support, and operational governance.
Accessing the section #
From the Provider menu, select the Audit item.
The page shows the title:
Audit
with the description:
Review the audit activity for your provider and tenant.
This means that the Provider can consult events relating both to their own Provider level and to the tenants belonging to their perimeter.
Available filters #
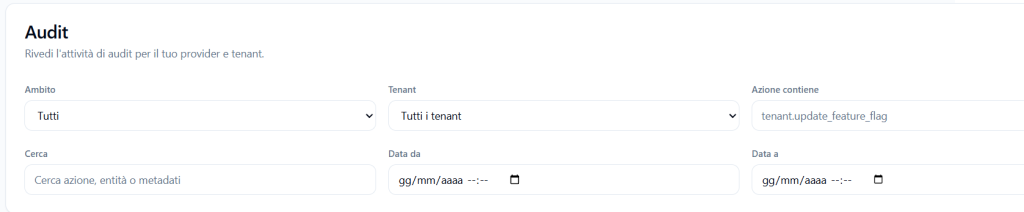
The upper part of the page contains filters that allow you to narrow down the event search.
Scope #
The Scope filter allows you to select the functional area of the events.
Example:
All
or events belonging to a specific scope, such as Business.
The scope helps to distinguish the general type of the recorded event.
Tenant #
The Tenant filter allows you to view:
- events from all tenants;
- events related to a specific tenant.
It is useful when the Provider wants to analyze what happened within a single tenant.
Action contains #
The Action contains field allows you to search for events based on part of the action name.
Example:
tenant.update_feature_flag
or:
provider_simulation
This filter is useful when you know the type of event to search for.
Search #
The Search field allows you to search by action, entity, or metadata.
It can be used to quickly find events linked to:
- a simulation;
- a runtime;
- a tenant;
- a specific action;
- a technical identifier.
Date from / Date to #
The Date from and Date to fields allow you to filter events by time range.
This function is useful for reconstructing what happened in a specific period, for example during:
- a publication;
- an internal test;
- a resource modification;
- a distribution to tenants;
- an operational problem.
Audit events table #
The table shows the recorded events.
The main columns are:
Time #
Shows the date and time the event was recorded.
Example:
18/06/2026, 15:59:22
This column allows you to reconstruct the chronological sequence of actions.
Scope #
Shows the functional scope of the event.
Example:
Business
The scope helps to classify the type of activity recorded.
Provider #
Shows the technical identifier of the Provider to which the event belongs.
This ID is useful for administrative checks or technical support.
Tenant #
Shows the tenant involved in the event.
It can be:
- the name of the tenant;
- a technical ID;
- an empty or unavailable value, when the event concerns only the Provider or a Provider internal test.
Actor #
Shows who generated the event.
It can be:
- a user;
- an administrator;
- the system.
When system appears, it means the event was automatically generated by the platform.
Examples of system-generated events can be:
- rebuild;
- automatic activations;
- allocations;
- runtime generation;
- completion of internal processes.
Action #
The Action column describes what happened.
Examples:
- tenant_entitlements_allocated
- provider_internal_test_runtime_activate
- stimulus_simulation_internal_test_created
- provider_simulation_published
- provider_simulation_approved
- provider_simulation_syscheck
- provider_simulation_unpublished
This is the most important column for understanding the type of event recorded.
Entity #
The Entity column shows the technical object linked to the event.
It can be, for example:
- tenant_entitlements;
- runtime_simulation;
- simulation.
Next to the entity type, the technical ID of the object may also be shown.
This information allows you to link the event to a specific resource on the platform.
View JSON #
The View JSON button opens the technical metadata of the event.
This data is especially useful for technical support, debugging, or advanced verification.
Audit JSON metadata #
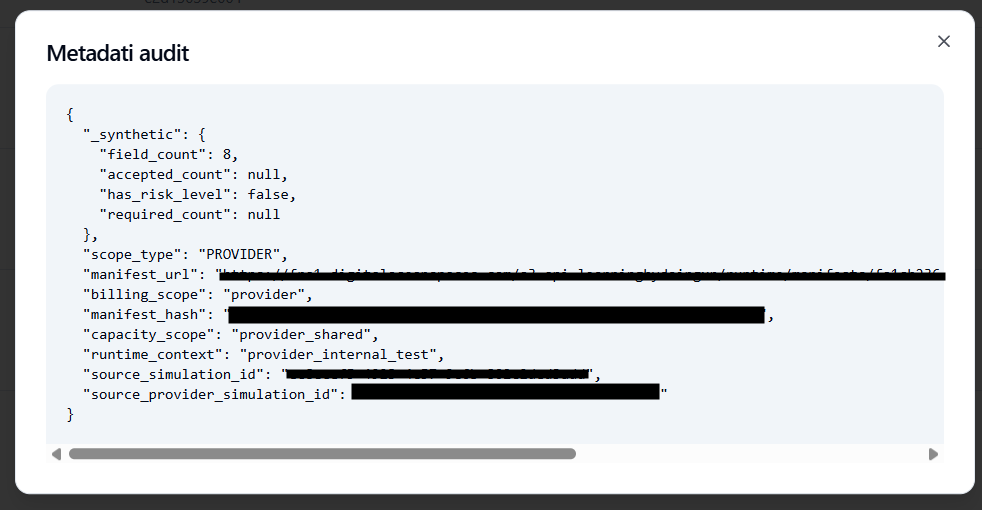
Clicking on View JSON opens a window with the Audit metadata.
This window shows technical information in JSON format.
Metadata may include, for example:
- summary data on the event;
- internal counts;
- event scope;
- manifest URLs or hashes;
- billing scope;
- capacity scope;
- runtime context;
- source simulation ID;
- Provider simulation ID;
- information useful for the technical reconstruction of the event.
What JSON metadata is for #
JSON metadata is used to accurately reconstruct what happened behind the scenes.
They are useful when you need to verify:
- which manifest was generated;
- which simulation produced a runtime;
- if an internal test consumed Provider resources;
- which billing scope was applied;
- which capacity was used;
- if an event is linked to a Provider simulation or a tenant;
- if the system correctly recorded an automatic action.
Normally this data should not be modified or interpreted by the end user.
They are intended primarily for technical analysis and support.
Examples of Provider audit events #
tenant_entitlements_allocated #
Indicates that resources for a tenant have been allocated or updated.
It may concern:
- assigned minutes;
- assigned users;
- assigned runtimes;
- limits;
- overage;
- entitlement configurations.
provider_simulation_syscheck #
Indicates that a SysCheck has been started or recorded on a Provider simulation.
It serves to track the technical verification of the simulation before approval or publication.
provider_simulation_approved #
Indicates that a Provider simulation has been approved.
After approval, the simulation can proceed toward publication, if there are no other constraints.
provider_simulation_published #
Indicates that a Provider simulation has been published.
A published Provider simulation can be distributed to one or more tenants of the same Provider.
provider_simulation_unpublished #
Indicates that the publication of a Provider simulation has been canceled.
This event may appear when a simulation needs to be corrected, updated, or temporarily removed from distribution.
stimulus_simulation_internal_test_created #
Indicates that an internal test session linked to a simulation has been created.
This event is useful for tracking when the Provider has prepared an internal test.
provider_internal_test_runtime_activate #
Indicates that a Provider internal test runtime has been activated.
This event can be linked to the consumption of Provider minutes and the occupation of a shared slot during the test.
Difference between manual events and system events #
Not all events in the Audit derive from a direct user click.
Some events are automatically generated by the platform as a consequence of a previous action.
Example:
- the Provider starts an internal test;
- the system creates the internal session;
- the system activates the runtime;
- the system records linked audit events.
In this case, some events may appear with the actor system, even if the process originated from a Provider action.
When to use the Provider Audit #
It is useful to consult the Audit section when:
- you want to verify if a Provider simulation has been approved;
- you want to check when a simulation was published;
- you want to understand when a SysCheck was started;
- you want to verify the creation of an internal test;
- you want to check if an internal runtime has consumed resources;
- you want to reconstruct a sequence of events;
- you want to verify a change to a tenant’s resources;
- you are analyzing an operational problem;
- technical support requests an event ID, entity, or metadata.
What the Provider Audit does not show #
The Provider Audit is not training reporting.
Normally it does not show:
- Player readiness;
- Communication Skills achieved;
- individual reports;
- transcriptions;
- key moments;
- Player performance;
- Observation Grid evaluations.
For this data, you must use the dedicated Report sections, respecting the configured privacy policies.
How to read the audit correctly #
To correctly interpret an audit event:
- check the Time column to understand when it happened;
- check the Action column to understand what happened;
- verify the Tenant involved, if present;
- read the Actor to understand if the event was generated by a user or the system;
- check the Entity to identify the object involved;
- open View JSON only if technical details are needed.
Best practices #
To correctly use the Provider Audit section, it is advisable to:
- use date filters to narrow the period;
- filter by tenant when analyzing a specific environment;
- use “Action contains” to search for known events;
- not interpret system events as direct manual actions;
- open JSON metadata only when a technical check is needed;
- use the Audit together with the Report and Plan and Resources sections to reconstruct usage or consumption issues;
- not use the Audit as a tool for training evaluation of Players.
Final result #
The Provider Audit section offers a chronological and technical view of the activities recorded within the perimeter of the Provider and its tenants.
It allows you to check what happened, when it happened, which entity was involved, and whether the action was performed by a user or the system.
It is a tool for governance, traceability, and operational support, useful for reconstructing events and verifying the correct functioning of platform processes.


